At Americaneagle.com, page speed has been a concern and focus of attention for as long as we’ve been working on websites. Websites, though, have definitely changed and become much more complicated, heavier, and jam packed with assets. This is because the internet has become a part of everyday life at home and on the go. In the process, attention spans and dedication to websites has gotten shorter. Google, BBC, and others note an amazing speed for a page to load is about one second. This is a tall order, especially when it comes to slow connections with weak signal strength for a user on the go with their phone.
Luckily, as the web became more complex and on the go, more tools and best practices came into fruition to help keep setups in check. Some of the testing tools out there includes WebPageTest, web developer tools in browsers, Pingdom Tools, and PageSpeed Insights. The focus of today is on PageSpeed Insights (PSI) because it is a Google created product and many web admins/owners are using it.
The tool is definitely very insightful with a lot of best practices and thoughts put into it. We use it regularly ourselves. However, over time we started to see companies and the tech world focused on the impact on SEO and getting perfect speed scores. There seemed to be a growing misconception on how deeply coupled the page speed score is to rankings and how the diagnostics for improvements were interpreted as absolutes for fixing problems. Google algorithms and the like are black boxes, so it’s understandable. Today, I’d like to dive a bit deeper and help clear up some of these concerns. At the very least, we can all take a step back and remind ourselves:
The “Speed Update,” as we’re calling it, will only affect pages that deliver the slowest experience to users and will only affect a small percentage of queries. It applies the same standard to all pages, regardless of the technology used to build the page. The intent of the search query is still a very strong signal, so a slow page may still rank highly if it has great, relevant content.
--Official Google Webmaster Center Blog
Getting Into Some History
Google first added in a ranking factor of page speed back in 2010. The goal was to improve the end user experience because a faster web is a good thing for everyone. Every additional second has shown to impact conversions in many cases. However, as for the SEO impact of the change, even in 2013 Moz testing showed no correlation between “page load time” and ranking on Google’s search results pages. The main thing is what page load time classically meant – “document complete or fully rendered”. It should be noted that TTFB (time to first byte) did show correlation with the rankings so back-end performance was influential when front-end performance was not.
Also in 2010 in relation to the page speed additions to the Google ranking factor, PageSpeed Insights was introduced. Initially, PSI had its own criteria of testing and, like today, still has a score based system of 0 to 100 with the latter being a very fast site. Since it is an automated tool, there were times you could actually trick it to make better scores. For a long time there also weren’t great indicators on what would actually increase your page speed. You could also get stuck at certain maximum values while using Google tools on your site, such as Google Fonts, Google Analytics, etc. In the past we saw having some Google Fonts on your site could reduce your score by 13-15% for mobile. There were also suggestions such as minifying the HTML which you could work on and it wouldn’t actually improve your score.
Starting in July 2018, from the quote I cited earlier from Webmaster Central Blog, Google put the “Speed Update” into their algorithms. PageSpeed Insights, Lighthouse, and the like were already around and this new initiative pushed these into the limelight for marketers, SEO teams, and site owners. The update was aimed at improving the end user experience again but more focused on mobile devices, which is completely understandable with how the world has grown in mobile users.
Also, in November 2018, it switched its testing engine to Lighthouse, which is an open-source automated testing tool that dove even deeper into best practices. This improved a lot of the suggestions and started acknowledging lazy loading for assets as a practice. The scoring was much more tied to speed than any of the suggestions as well. You could have a blazingly fast speed and better score and still have lots of notes from PSI. However, it is still an automated tool, so over time there started to be further questions of how scoring worked and expectations of the Lighthouse lab tests.
Misconception #1 - The Score (maybe it isn’t everything)
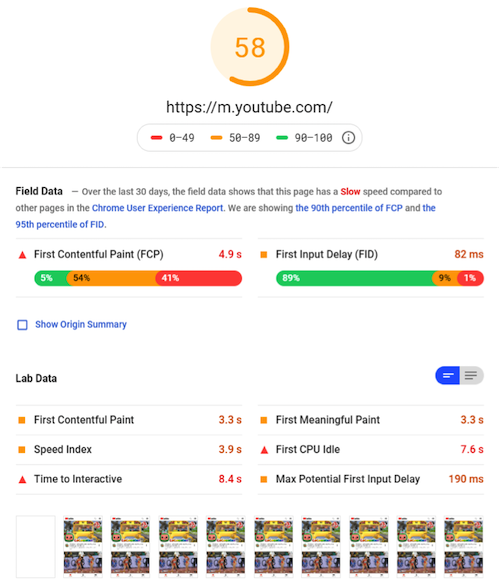
Companies with large amounts of users and high rankings in SEO with less than ideal scores included Amazon, CNN, Walmart, and even Google’s own Youtube. The page speed insights for mobile, as seen at the time of this writing, were ranging from 3 to 58 in scoring. These are big companies that are still quite successful but aren’t scoring 100s. Many platforms, CMSs, build systems, etc. all have overhead costs and different levels of optimizations. Most of these sites still have a First Contentful Paint (time till the user sees the page) of around 2-3 seconds. These are actually pretty good initial rendering scores but they aren’t 100s in score for PSI.

This is an especially true pain point on the mobile version of the test (for those aiming for 100) because the testing was against a simulated 3G poor connection to determine if the site is fast enough. This is a very tough benchmark for a complicated site. Lighthouse has since updated to low 4G as well to try and help with that. Also, for most users the speed and user experience for a decent connection would actually be much better. In the community for Lighthouse there are even discussions on the credibility of the issues and scoring. They wonder why a score of 2 could have a First Contentful Paint (FCP) of 1-2.5s in decent connections. If a business is using this score as a determining factor of whether a page is fast or not, this sets a false sense of speed. The score would make many think this is the slowest site ever but these scores can happen on normal speed sites.
Also, for Single Page Applications (SPAs) testing and scores get a little bit more complicated. The initial load of the first page ends up being much larger than subsequent pages. After initial load, many times all subsequent pages can be incredibly fast because they aren’t actually loading new pages but rather getting the data (sometimes even preloading it) to populate the main content areas via Javascript. Many of these testing tools are done on the first page so the tools take each individual page as the full load rather than the true end user experience, which is faster on every subsequent page while traversing the site.
Above all, from an SEO standpoint, you can tell from everything we know that Google doesn’t use these specific scores to rank. They also don’t rank with page speed alone. There can be another 200+ other ranking factors that weigh heavier or lower than page speed. If your content is important and people love coming to your site for it, your ranking will likely still be high.
Misconception #2 - The Fixes (maybe they aren’t the only ideas)
So, from an SEO perspective, as noted above, it might not be a true indicator or impact if you already have great content and some progress in speed (not taking 20 seconds to even see content). This doesn’t mean the tool isn’t helpful or that page speed in general isn’t important. Page speed is still very important from the UX and conversions perspective. So using PageSpeed Insights and other tools to better determine health should continue to be used.
However, a common aspect we see from using PSI is the list of suggested fixes. This also has a precedent of being misunderstood as being the exact checklist to use to get a faster site. The suggested fixes also don’t indicate how much effort is going to be put in to achieve these because each build system for sites is different. This is why it is best to work with developers and teams to determine how much ROI would be gained from the effort used to improve these potential impacts. Luckily, the results pages for PageSpeedInsight note that, “These suggestions can help your page load faster. They don't directly affect the Performance score.”

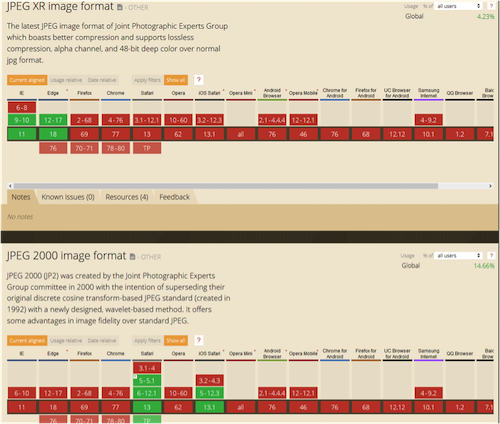
CanIUse data showing the inconsistent support for some of these next-gen formats
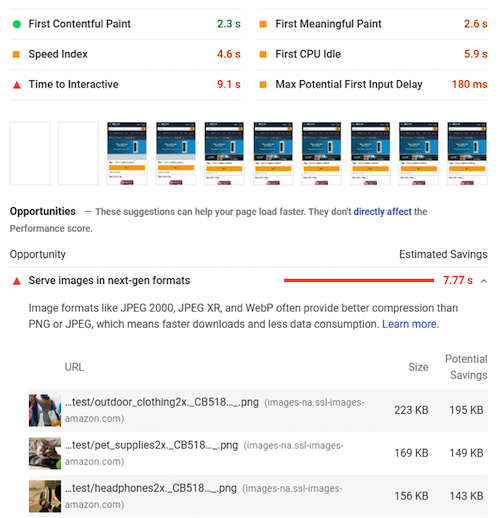
There can also be some misunderstood gains by taking a list at face value. A common one is the recommendation of next-gen image types saving large amounts of data. As shown in the diagram below, they are noted as potentially saving almost 7 seconds. However, it’s for a site that doesn’t take 7 seconds to see the content. These are estimates of benefits so the actual gains of making the change could be far less than the amount noted.
The effort is also larger than what it would seem. Next generation image types are in the same boat as video types a few years back; there are many out there and most browsers don’t agree on one approach/file format. This means development and accounting for all types can be taxing and difficult to maintain. When, in reality, putting images through a compression tool like TinyPNG or Kraken.io could actually save just about the same amount (a little bit less since the file types do have some better compression). Many content creators aren’t aware of image compression tools and not all platforms have these built in. This is where the list actually doesn’t always show the real gain approaches with less effort.

PageSpeed Insights screenshot for amazon showing 7.77s could be saved with next-gen formats when first meaningful paint is 2.6s
Another example that wasn’t recognized in earlier versions of PageSpeed Insights was the aspect of lazy loading (waiting to load assets only when they are needed/in view). If your site has hundreds of images on the page, no matter how much you compress and use next-gen imagery, etc. it would still be too much for the initial load of the page. You would want to wait until the user needs to see the images to load them. PSI does note these now (which is great), but it is an ever improving tool so there are still false positives as well.
The main thing is it’s a helpful checklist but it shouldn’t be taken at face value as the absolute truth. The scoring and suggestion to fix them may have little relation. The suggestions for fixes are still good ideas on improvements and many could likely reduce your score. However, getting closer and closer to the one second load time can be a bit of an exponential curve. So for any of the fixes there should be a discussion of weight of effort compared to the potential gains. Thinking outside of the list can give you a boost as well. Your score could be amazing while many of these suggestions aren’t done.
Is actual page speed important? Absolutely.
There is no denying that a faster page speed provides a better user experience, reduces bounce rates, and can increase conversions. Getting closer to the one second page load time is indeed a great goal, even if it is a quite difficult one. I don’t want this article to somehow mean that PageSpeed Insights, Lighthouse or any tool out there shouldn’t be used. These are all going to help you better understand the gaps of a site. Hopefully, you can see that they are indeed helpful metrics but sometimes expectations and misunderstandings of the results could paint the wrong picture of your site’s health. I just wanted to take a step back and take all good information with a grain of salt.
There are a lot of lists and best practices articles out there and the goal of this article isn’t to go into every fix ever known. However, I’ll include a quick breakdown of the common issues that we see that do get the most gains. The main thing is that at Americaneagle.com we can help consult and improve your speed, SEO, and UX goals.
Quick Breakdown of common issues which have a bigger impact:
-Do you have a CDN? No? This could be a major help
-3rd party trackers. A perfectly fast site could be made into a really slow one depending on how many trackers, marketing tools, etc. get thrown in after a site launches
-As noted before, image compression and proper image sizing is very important
-Not having lazy-loading is the one most common pattern seen on slower sites
-Font loading without any display swapping options
-JS bloat can influence a site, especially if it is a render blocker
--It takes longer to parse and process the file compared to an image
-The backend speed is probably the biggest one as well
--If it takes 2 seconds to get to TTFB because of all of the queries happening this bottlenecks the whole loading process
-Also, HTTP/2 has speed improvements depending on the setup of the site