The average industry win rate across split testing is typically about 20%. That means that only 1 in 5 tests may produce usable results. We tend to measure program success on only the winning tests but what happens to all that other data? Bob Dylan said, “There's no success like failure.” Is there something 80% of the data is not telling us? Take an educated guess and we’ll examine this at the end of the article.
Determining a Winning and Losing Test
Let’s first look at how to determine results of a test. There’s a lot more grey to look at than black and white. Even statistically valid wins don’t account for all winning tests. Grey outcomes, such as non-negative results, are often, and with careful interpretation, legitimately included as wins.
Winning Test Types
Positive - These are tests that achieve at least 90% significance. This means that there is only a 10% chance that the improvement being seen is due to random chance.

Figure 1: A positive test result showing a 99% statistical significance
Non-negative - While the test results may not have achieved a 90% statistical significance, we have enough historical data and confidence to say the variation will produce a positive contribution to the business.
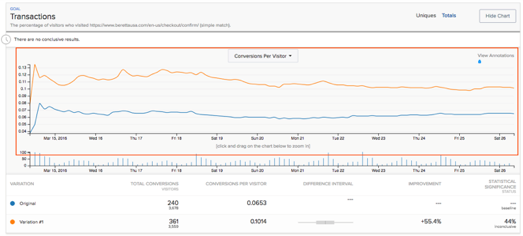
 Figure 2: A non-negative test showing the test variation outperforming the original over a wide time window (Orange line indicates the variation)
Losing Test Results
False Positive – This is a test that indicates a winner when there truly isn’t one. This effect is often produced by similar users at one end of the results being randomly grouped together. In this scenario the test will have achieved no significance but is indicating a clear improvement. Non-negative results need to be carefully scrutinized as they can often be false positives!
False Negatives – This is the opposite of a false positive. This is where the test looks like and reports as a losing test, but actually produced a winning variation.
Negative – This test shows at least 90% significance but has produced a clear loss in conversion in the variation.
Statistical Power and Significance
Understanding the different test results is the first step. The next step is based on both statistical power and significance. Let’s take a look at how these results map out in a typical testing program.
STATISTICAL POWER GRAPH

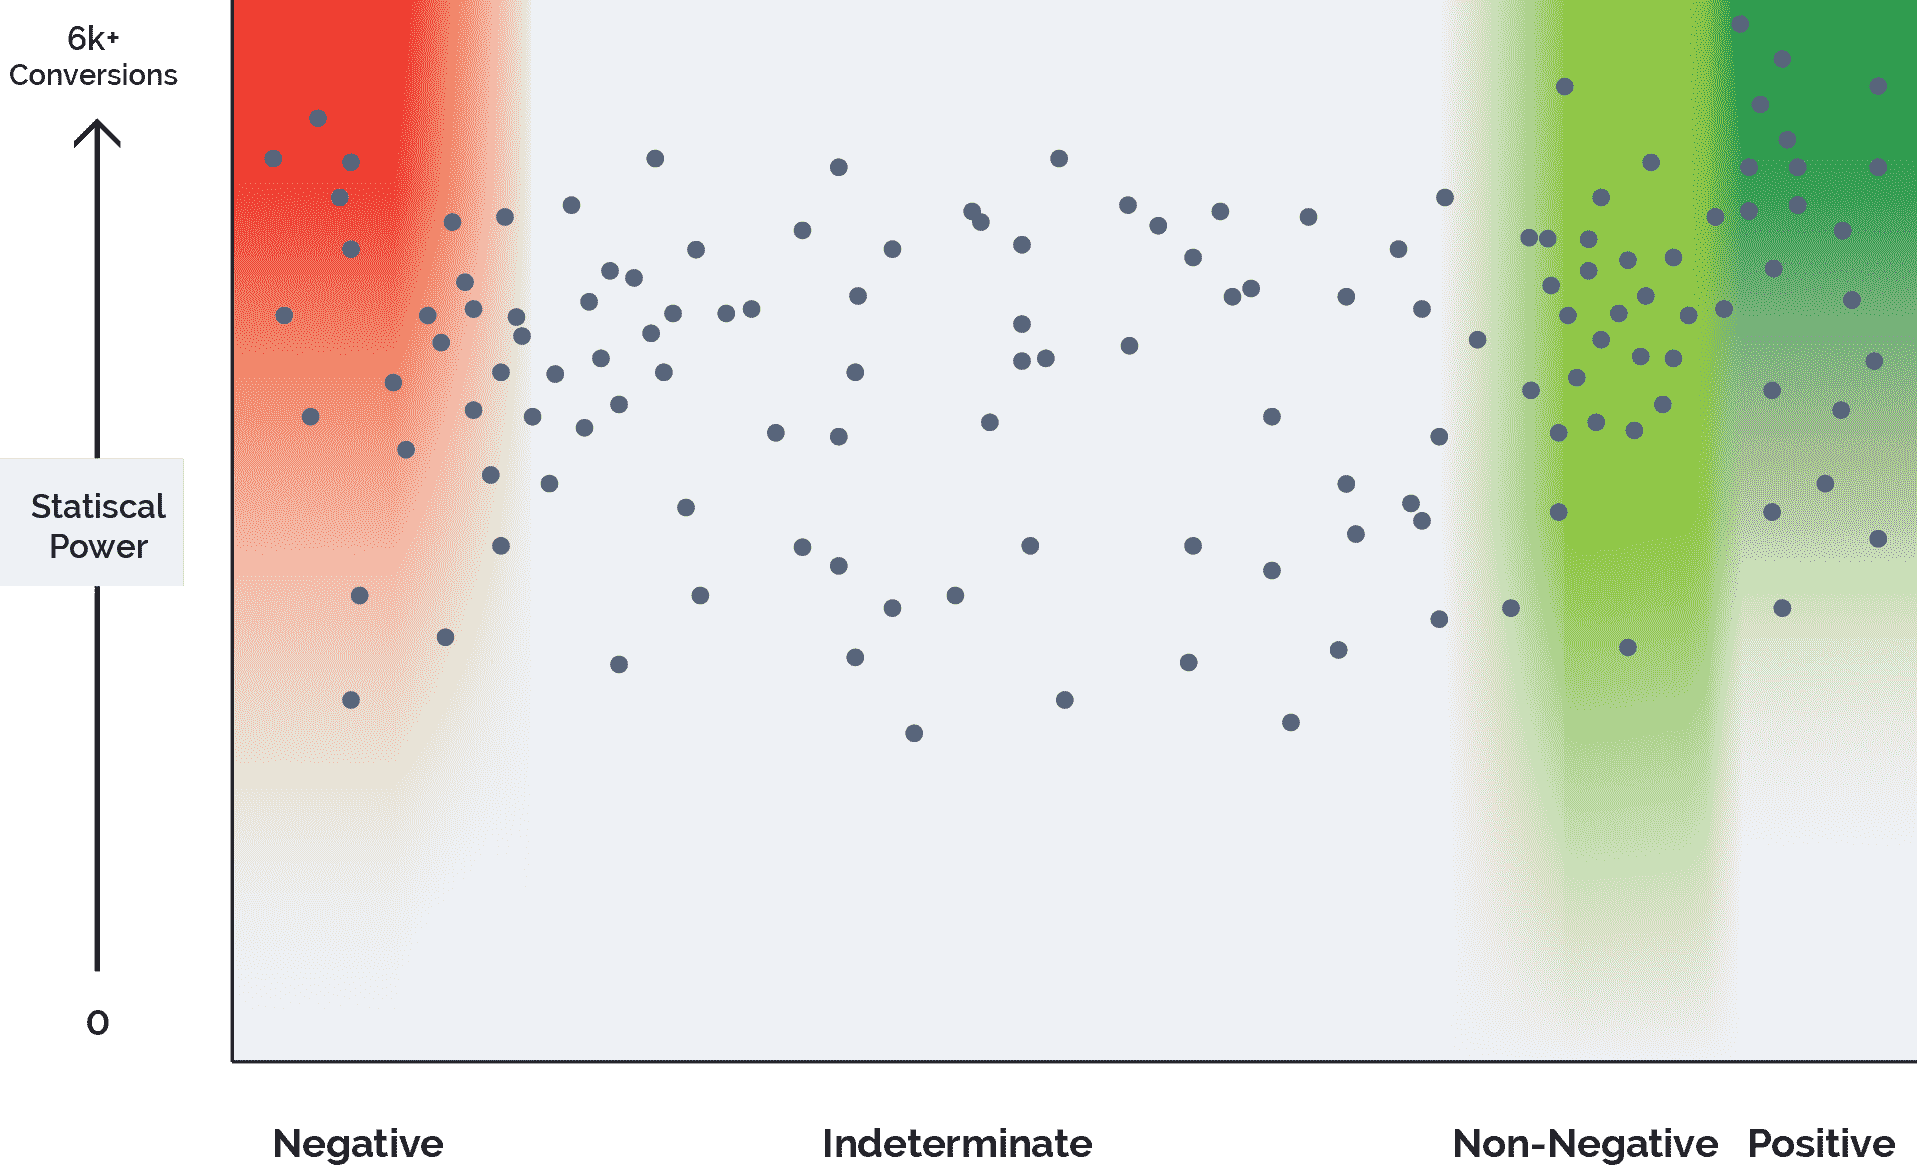
This is what a typical testing program results looks like. There are several important things to point out:
- The vast majority of tests do not achieve full statistical power.
- There is a large loose cluster in the non-negative region.
- Only a handful of positive tests reached statistical power.
- Many positive and negative tests reached only a qualifying majority of statistical power.
If all these tests as shown in figure 1.0 reached full statistical power, the results would look very different. Something like this…
SIGNIFICANCE GRAPH

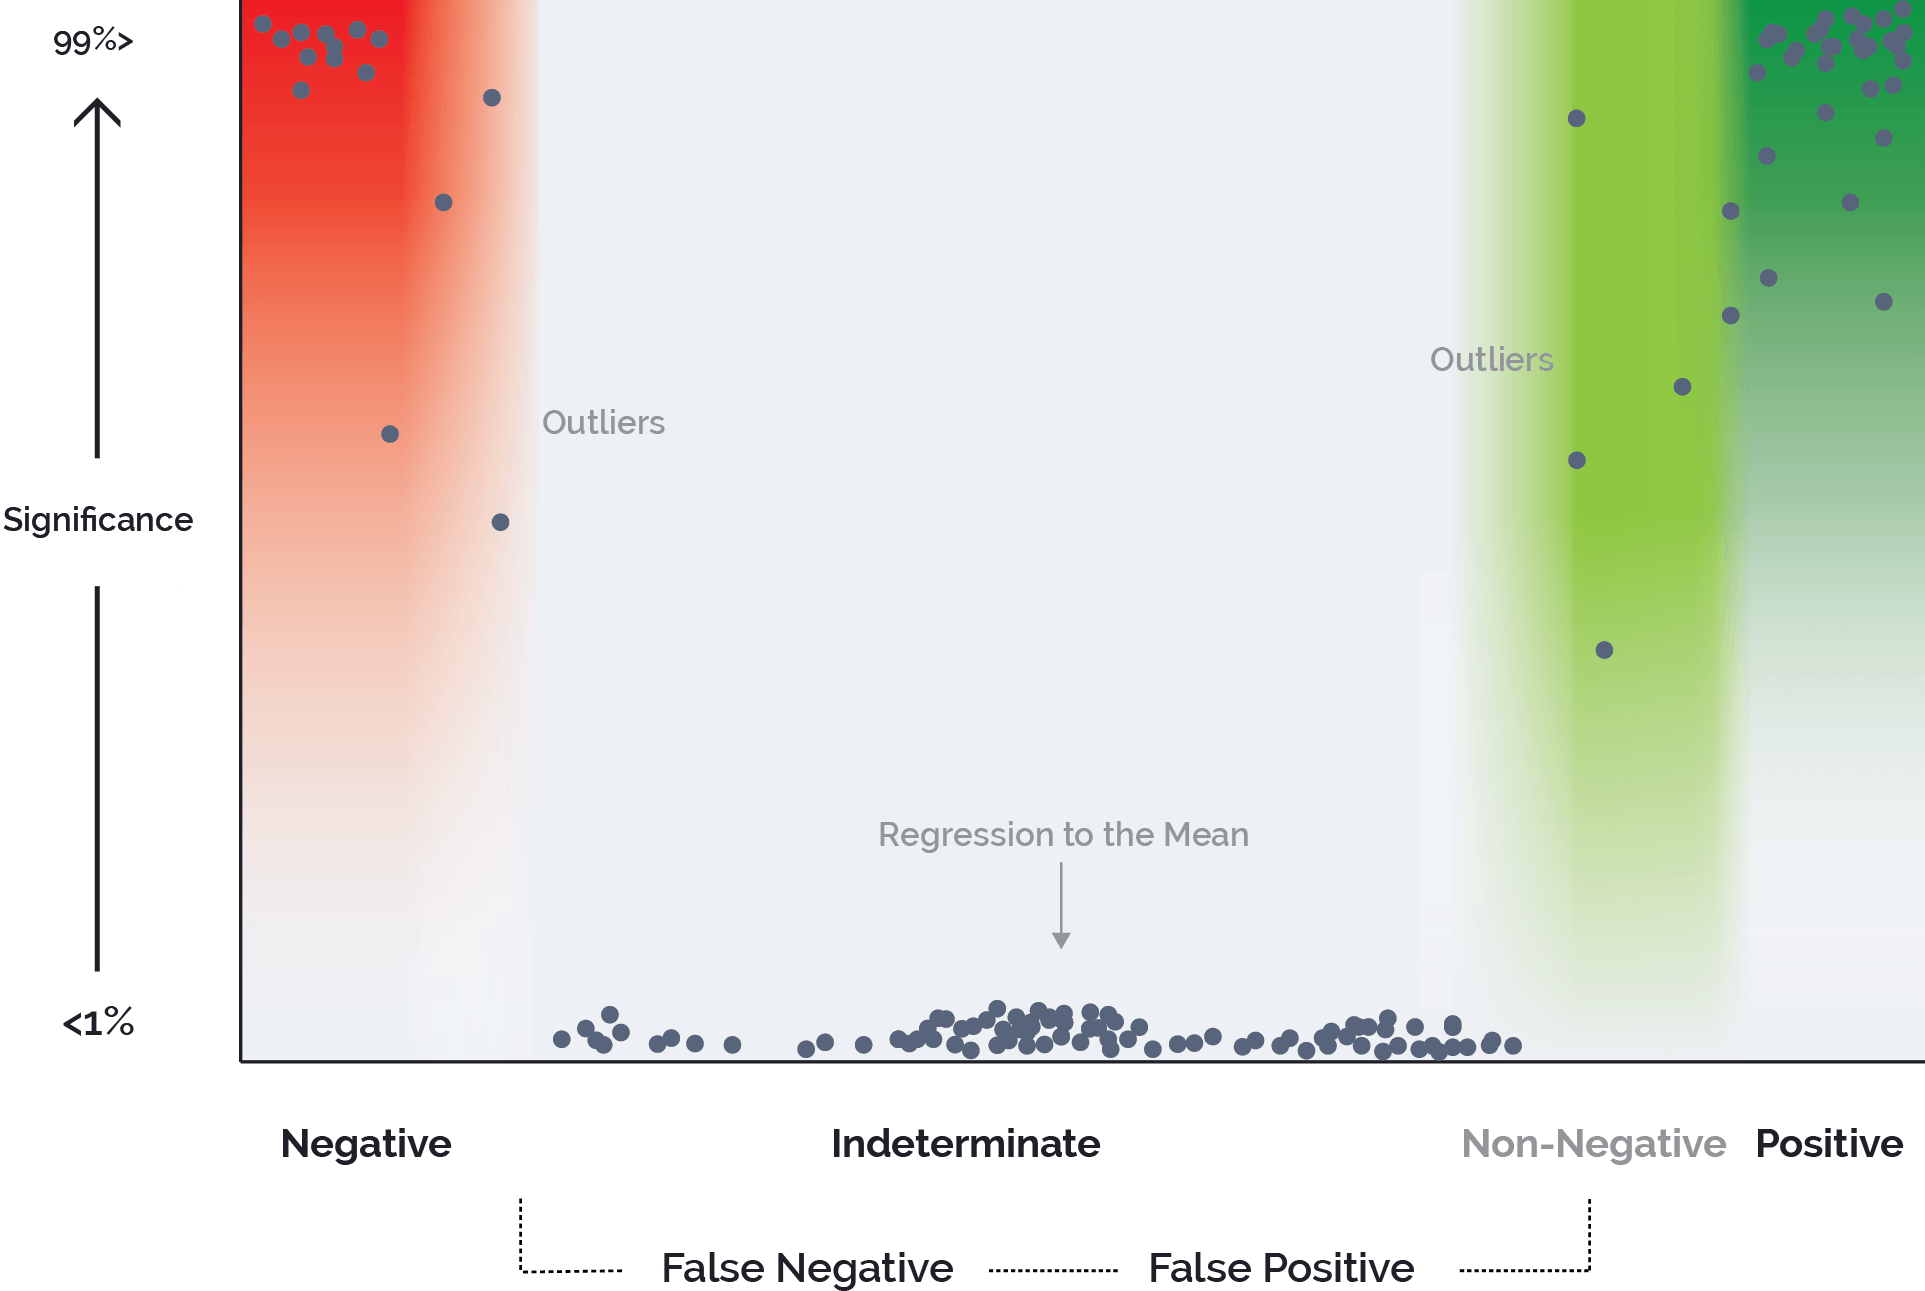
Here are the key differences for results that are allowed to reach full statistical power.
- While most of the indeterminate tests may have already had <1% significance (no significance), any indeterminate test that had some significance would most likely lose it completely due to regressing to the mean.
- The previous point is important because most of the non-negative tests could move to positive, with the possibility of many of them regressing into the false-positive zone.
- Any results that just continued to show positive or negative results but did not achieve 90%> significance may be considered outliers, thoughthere would likely be very few.
Interpreting All Results
Without allowing for full statistical power, the tester is often left with two types of ambiguous results that they must painstakingly interpret.
Indeterminate – False Positive and False Negative Results
These results are the easier of the two. This is simply because they are usually ignored. Without any significance and results that continue to vacillate and/or show very little improvement or loss, the tester is often compelled to just stop them. While this may be the correct testing protocol, it may also be a missed opportunity to hypothesize why the results came out the way it did. This may be risky or frustrating behavior to engage in, but it can often lead to productive discussion, iterative test ideas or completely new ones. Without taking the time to look deeper at these types of test outcomes, any possible gains from them get ignored with their outcomes.
Non-Negative Results
These appear to be positive results but do not achieve significance. What makes these results even more difficult to interpret, more so than results that have no significance and very little improvement or loss, is that the tester is forced to make a recommendation, based on perceived business value, on what may appear to be an improvement or just completely ignore the results on what may otherwise present itself as a gain.
So why is this type of result utilized at all when there is no actual statistical evidence of improvement? As previously mentioned, there is some level of perceived business value and/or it appears as a UX/UI improvement. More formally, this type of result may not produce the improvement percentage the testing platform is purporting but it is likely to bring in a positive overall contribution.
This result type can be very common and, without full statistical power, misinterpreted. What’s labeled “non-negative” is likely a positive result that hasn’t been given enough time or conversions to come to fruition or it’s a “false-positive” in disguise. It is important when reporting improvement on any non-negative test to cut-down projections to account for this contingency. Without discounting non-negative results, the experimenter is likely to report a number to the client that does not match the true outcome at the end of their projection.
Summary
So why not let everything run to full statistical power? In many cases, there is not enough justifiable business value or it’s just not possible. 6,000k+ (this number just appears out of nowhere without explanation) conversions (figure 1.0) for smaller sites with less traffic could take months or longer. Every tester is faced with results where critical decisions are based on experience, common sense, and sometimes educated guesses versus hard empirical data. One way to evaluate your testing program is gauge how many tests are ending this way.
If the majority of your positive tests are non-negative, you run the risk of overestimating improvement. On the other side, it’s just as important to interpret positive and negative results in order to build a successful roadmap for your testing program. It’s not enough to ignore a loss, implement a win and just move on. Discussing and iterating on all types of test results will allow for the most comprehensive understanding of your customers and how they utilize your site while building your overall business intelligence.
