Welcome back! Last post I explained some of the basics of using Google Analytics. Today we’ll go further in depth on how to maintain and analyze your data and you’ll learn what data is most likely to be important to your site.
Maintaining Your Data
Daily / Weekly / Monthly Audits
Manually, you can use programs such as screaming frog (https://www.screamingfrog.co.uk/seo-spider/), or websites such as http://www.gachecker.com/, or other automated websites to make sure each page has the Google Analytics code and is reporting correctly.
Make sure to:
- Monitor as often as you can. It only takes one change to nullify code.
- Check for code on each page.
- Look for anomalies in data.
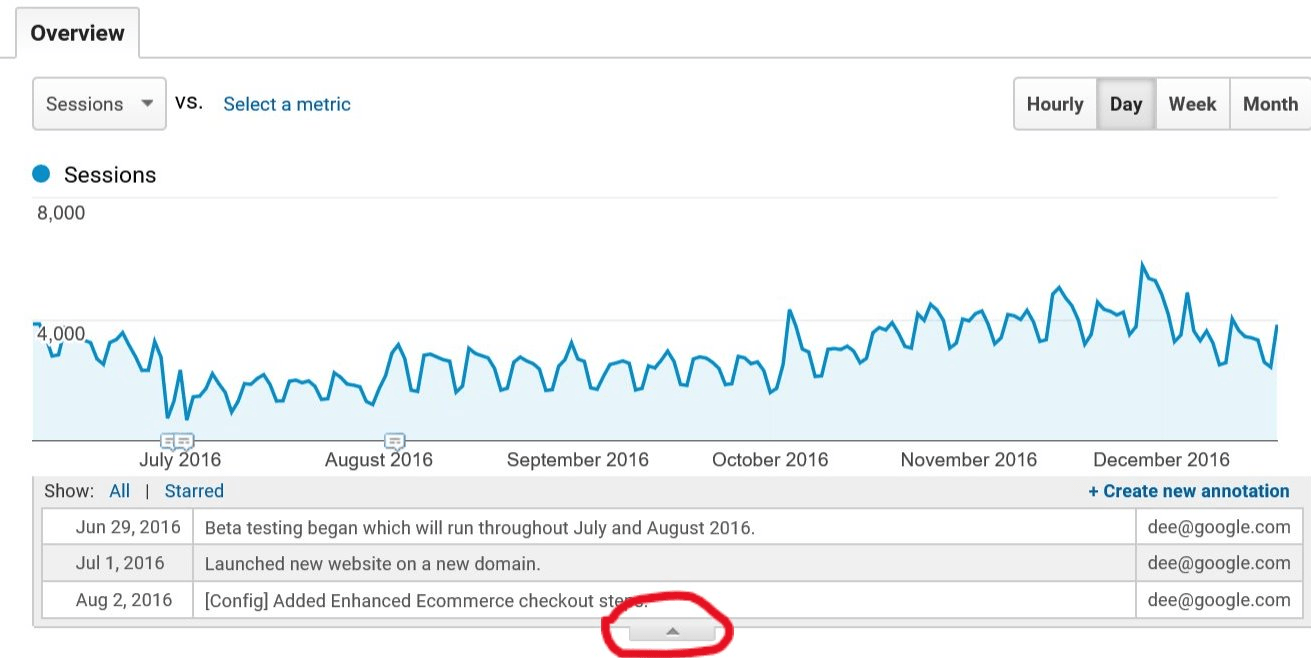
Keep notes!
Keep notes of your changes, especially if there are multiple people working on your site. Use the
annotation tool.
This tool is available on all reports by clicking on the drop down arrow under the visualization of the page.

Analyzing Your Data
Data That Matters To All Sites
The key points to remember are the following:
-
Check your acquisitions (where your traffic came from)
- Located at Acquisition>All Traffic>Channels
- Make yourself familiar with how people get to your site. Check channels such as direct, organic, and referral traffic. This is really good data for SEO in particular (link building). Additionally, once you know where people are coming from, you can change content to direct users to different parts of your website.
- Look deeper in to referrals… Find out where you are getting most of your visitors from.
- Note the bounce rat on these pages. This is the percentage of people that are leaving immediately after arriving. Set up changes on these pages to drive users to places you need them to go in your site.
- Pages with high bounce rates can be prioritized for immediate attention, and split tested to test fixes, as explained in this blog post.
- Check Bounce Rate vs. Exit Rate.
A bounce is when someone enters a page within your site and leaves immediately without clicking on anything, while Exit Rate is the percentage of views that were the last in the users session. Of these two pieces of data, Bounce rate is a more interesting number to look at, since these are users that aren’t even staying on the page.
*Bounce Rate for a page is based only on sessions that start with that page.*
- Top exit pages is the opposite of landing pages. These are the pages that people are leaving on. Do these URLs make sense as an exit point? Has the customer left without reaching your goal? It might make sense to add an exit survey on this page.
Note: A high exit rate isn’t necessarily a bad thing; this depends on the purpose of the page. A blog post can have both a high bounce and a high exit rate… though you will want to try to drive traffic further into your site with specific content.
What Data Matters to YOUR site?
Content sites
If you run a content site, the metrics that are likely to be most important are:
Time On Site
( Audience > Behavior > Engagement ) – Aggregate data of session duration and pageviews per duration (How long each person took on site)
( Behavior > Site Content > All Pages : Avg. Time on Page ) – Average time a user takes on each page
Frequency And Recency
( Audience > Behavior > New vs Returning ) - # of sessions that are new vs returning – content sites will want higher Returning
( Audience > Behavior > Frequency & Recency ) – How many times a user has come back.
Ecommerce sites
- Sales / Transactions
- Purchase Goals
For ecommerce, the base level of what you have to worry about is sales/transactions and purchase goals. Make sure to check the orders coming into Google analytics against your CMS/raw order data to make sure your orders are reflecting correctly.
Informational / Business Sites
- Contact Form Goals
- Time on Site (Audience > Overview : Avg. Session Duration )
- Pages/Session
For B2B and informational sites, you want users to contact you, so set up contact form goals (adding page view goals to thank you pages/urls makes the most sense).
*Americaneagle.com can create these goals for you, and even create custom dashboards to view and monitor these goals. *
Time on site is also a big one for informational sites. You want to make sure customers are staying a long time to read your content.
What should you pay attention to?
-
Pay attention to how your data LOOKS. Always pay attention to EBBS and FLOWS – when you look at your data, does anything stand out?
- In terms of ecommerce goals, have there been any significant drops? Have you driven traffic to your site and not seen the goal increase like you should? Alerts can be set up when goal thresholds are met via custom alerts. This is a great way to make sure you are notified as soon as an alert threshold is met.
- Has there been a drop in traffic? Check your sources ( Acquisition > All Traffic > Channels)
Any further questions on the topics discussed here? We’d be delighted to help.
